Environmental Games
Real data about the place you actually live
Type in a ZIP code and each of these games rebuilds itself around that neighborhood, using the same public scientific datasets that researchers and government agencies use. Nothing is invented for effect: if the data for your town is undramatic, the game tells you so. Every game finishes with something you can do outdoors.
Free, no account, and nothing you enter leaves your device.
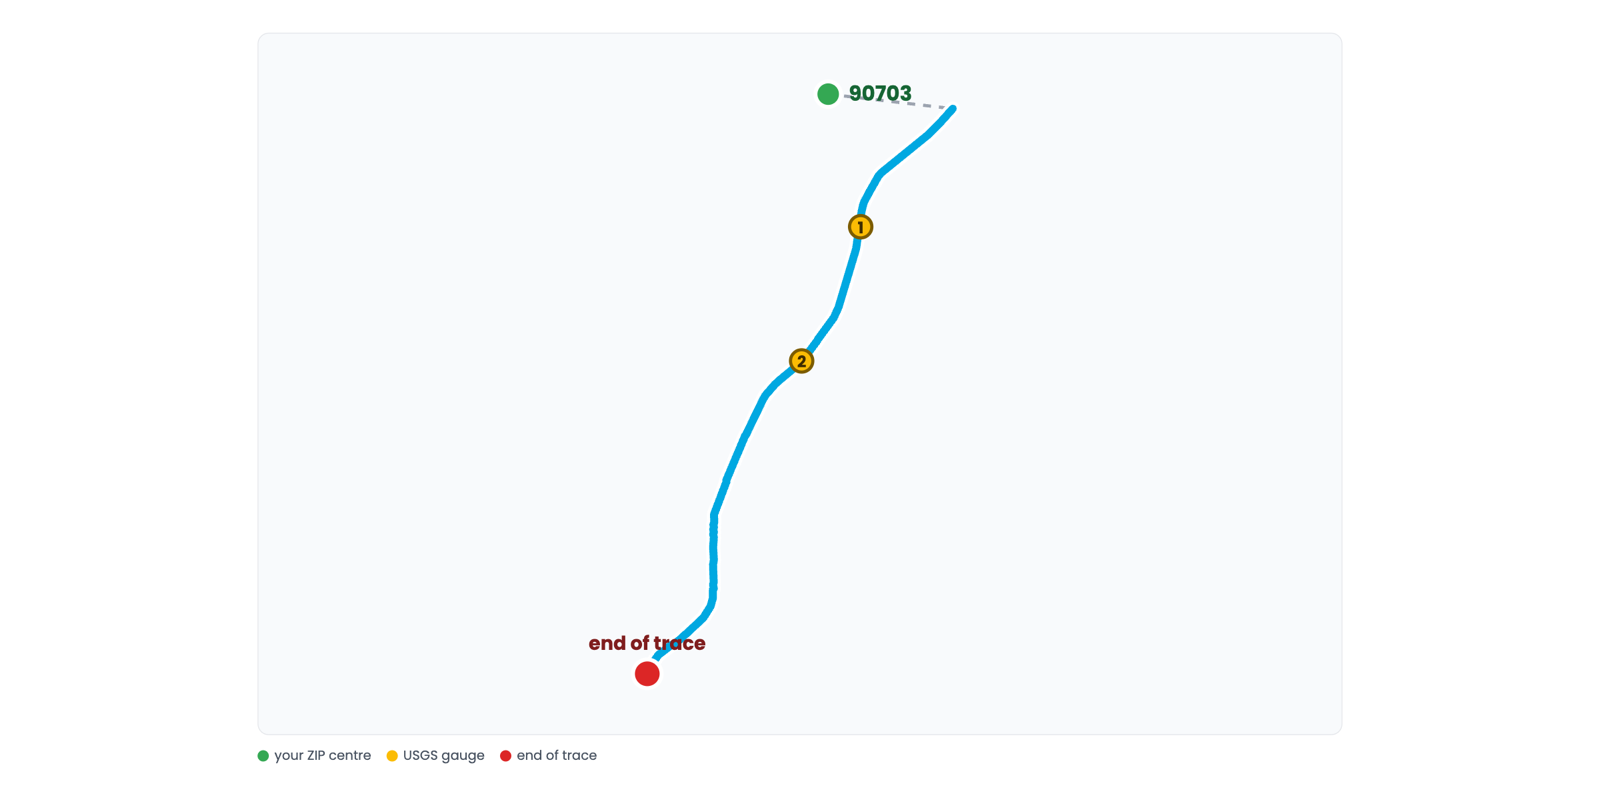
Storm Drain Detective
Guess where the water on your street ends up, then watch the real answer draw itself. Uses the U.S. Geological Survey’s river network to follow your nearest waterway downstream, naming the real gauges it passes and the real place it reaches the sea.
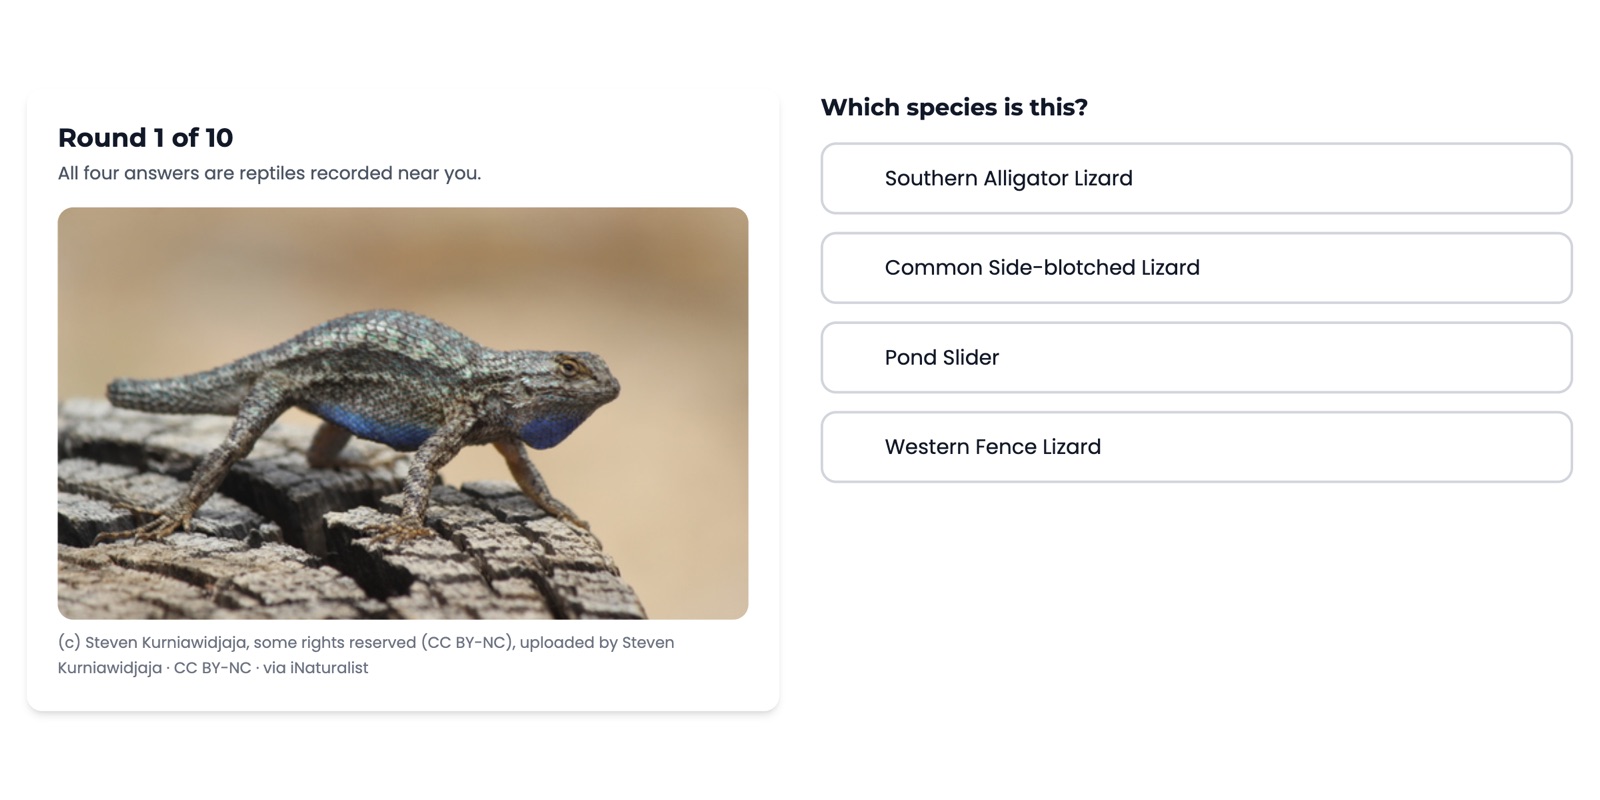
Backyard Bioblitz
Every photo is a real plant or animal that somebody actually recorded near your ZIP code. Learn to tell them apart, find out how often each one has been seen where you live, and print a bingo card of species you can genuinely go out and find.
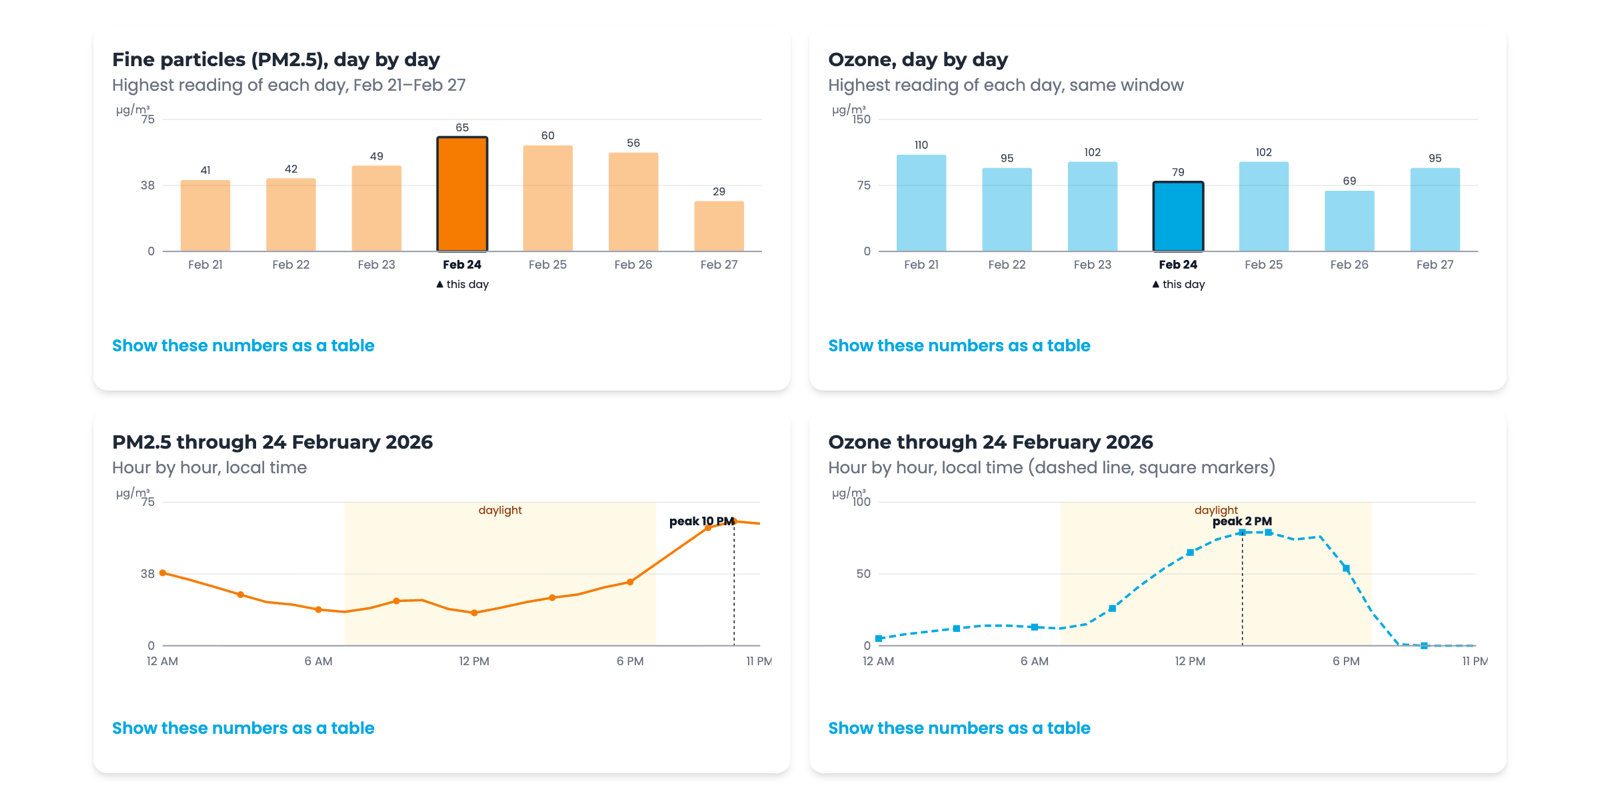
Air Detective
Real hourly pollution data from your own area, with the cause hidden. Read the clues — which pollutant moved, what time of day, what season — and work out what happened. Sometimes the honest answer is that the evidence is not strong enough, and saying so scores full marks.
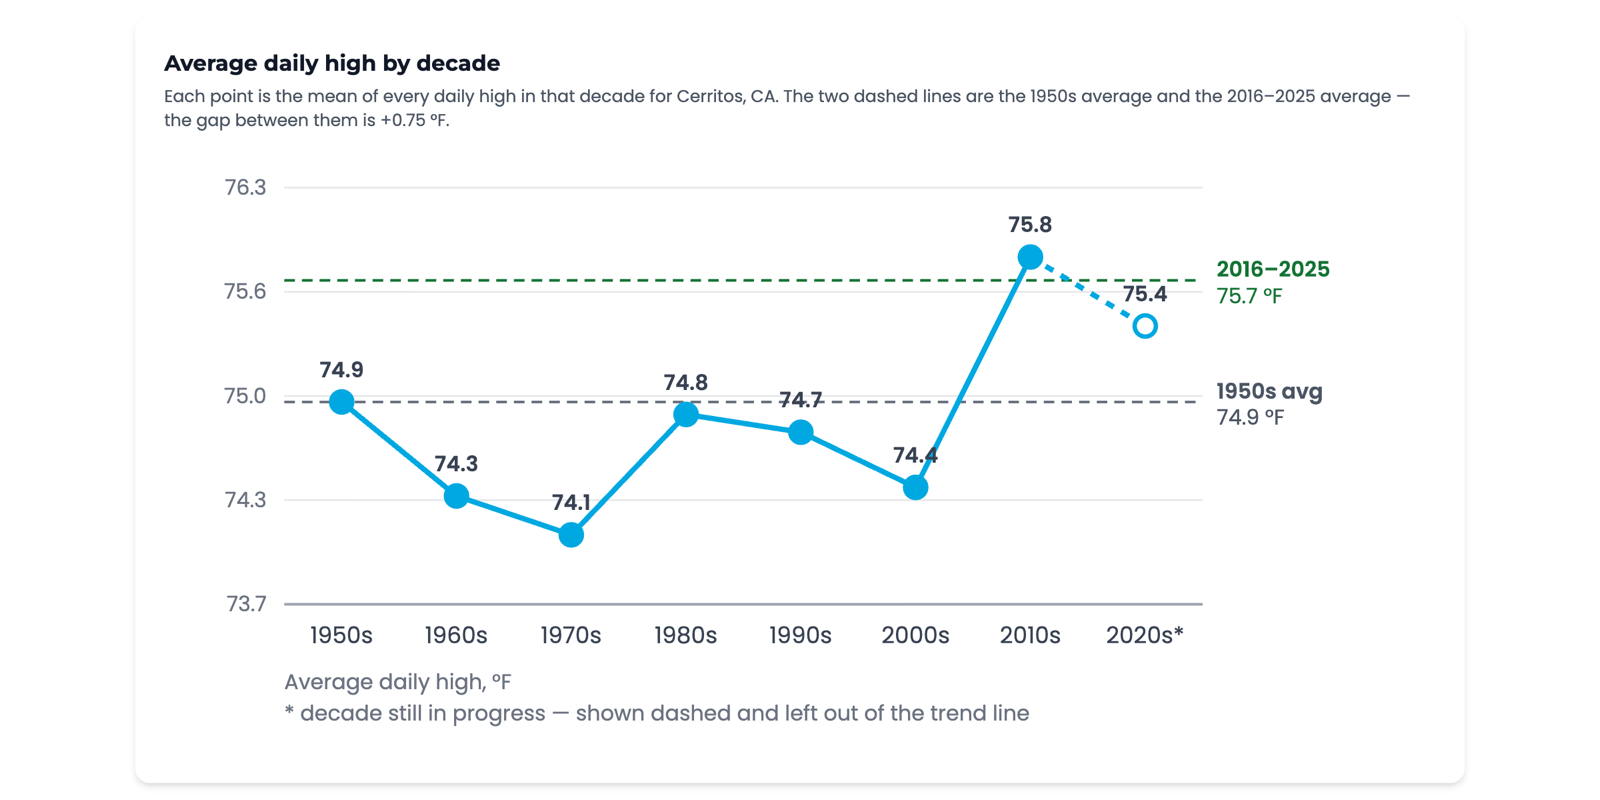
Your Climate Record
Commit to a guess about your own town before you see anything: how much warmer is it than the 1950s, and how many more hot days? Then meet the real 75-year record. You are scored on how close your guess was — not on how alarming the answer is.
Those four pictures are real screenshots of the games running, not mockups. Each one shows Cerritos, California — EcoQuest’s own city — because a screenshot can only show one place. Enter your ZIP code and you will see the same screens drawn from your town’s data instead.
The Backyard Bioblitz card shows a photograph © Steven Kurniawidjaja, some rights reserved, used under CC BY-NC 4.0 and shown cropped — via iNaturalist.
How These Games Work
Built Around Your ZIP
The species, the river, the air and the weather are all pulled for the place you enter — not a generic example.
Real Public Science
Every game names its data source on the page, and says plainly when a reading is a model estimate rather than a ground measurement.
Ends Outdoors
Each game finishes with a real task, a printable sheet for classrooms, and a way to contribute observations that scientists actually use.